How to Check Resource Usage in cPanel
This guide explains how to check your website resource usage in cPanel using the CloudLinux Resource Usage tool.
This can help you identify whether your website is running within its hosting limits or if something needs attention.
Each account has its own resource limits, which helps prevent one website from affecting others on the same server.
Why Check Resource Usage?
Within your cPanel account, you can easily monitor both current and historical resource usage. This is useful if your
website feels slow, shows temporary errors, or if you want to check whether your account is close to reaching its package limits.
If your website is using a large amount of resources, this may be caused by a plugin, theme, script, database query,
crawler traffic, or a configuration issue. In some cases, it may simply mean your website has grown and needs a larger hosting package.
Steps to Check Resource Usage
Firstly, log in to cPanel either through the Client Area or using your cPanel login details.
- Log in to cPanel.
- Go to the Metrics section.
- Select Resource Usage.
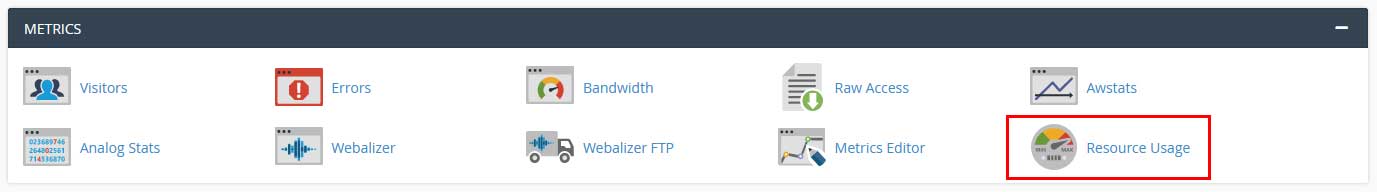
This will take you into the Resource Usage section, where cPanel will show a summary of your account’s recent usage.
Understanding Resource Usage Messages
In the Resource Usage screen, you may see one of several status messages.
Your site had no issues in the past 24 hours. This means your account stayed within its resource limits.
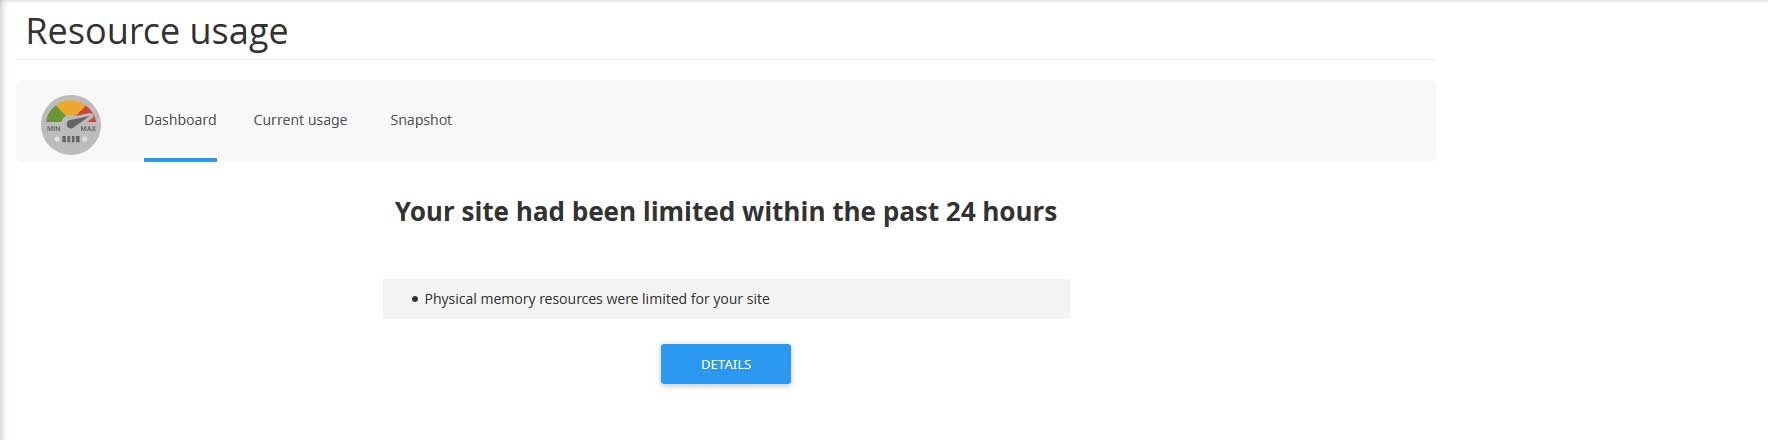
Your site has been limited within the past 24 hours. This means at least one resource reached its maximum limit.
Your site might hit resource limits soon. This means your account is getting close to one or more limits.
An example of a limited resource usage warning is shown below:
Viewing Detailed Resource Usage
To get a more detailed look at what is happening, click either Details or Current Usage.
Both options will take you to a more detailed usage screen.
Here you will see the different CloudLinux resource metrics listed.
- CPU Usage
- Physical Memory
- Input / Output Usage
- I/O Operations
- Entry Processes
- Faults
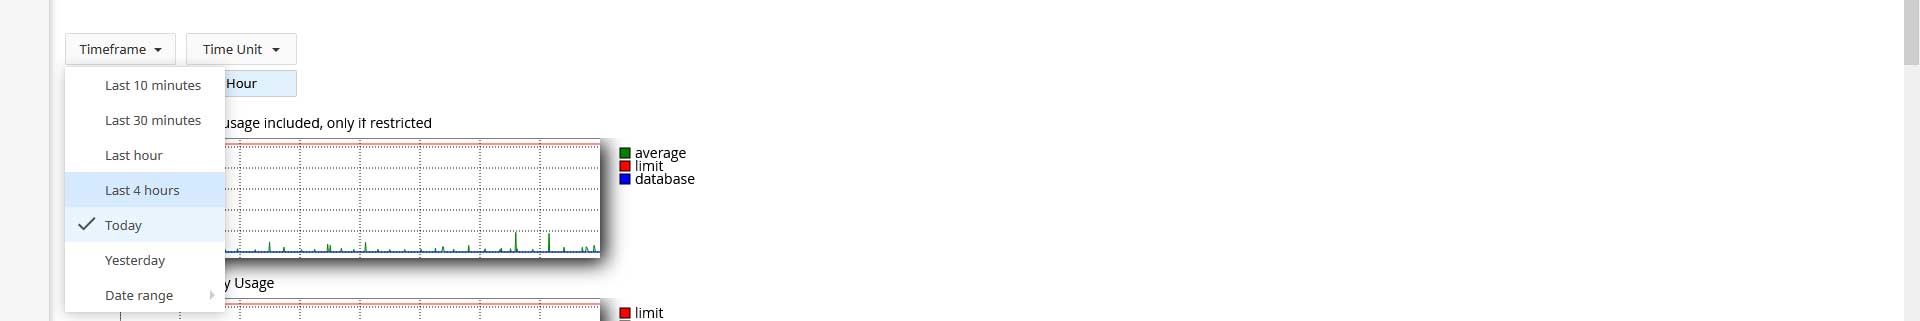
Using Timeframe and Time Unit
You can use the Timeframe and Time Unit dropdown menus to review usage over a specific period.
This is helpful if your website only has problems at certain times of the day or during busy traffic periods.
Using the Snapshots Tab
Depending on your site’s resource usage, you may also be able to view the Snapshots tab.
This can show more detailed information about processes that were running when your account hit a resource limit.
This information can help identify scripts, plugins or processes that are using excessive resources. It can also help
determine whether your website needs optimisation or whether a hosting package with more resources would be more suitable.
Database and HTTP Queries
In addition to the process list, CloudLinux may also provide information under the Database Queries
and HTTP Queries tabs.
These sections can be useful for identifying database-heavy scripts, slow queries, or website requests that may be
contributing to high resource usage.
excessive bots, poor caching, or database-heavy admin tasks.
More cPanel Tutorials
Need Help With Resource Usage?
If your account is regularly hitting resource limits and you are unsure what is causing it, please sign in to your hosting account
and open a support ticket. Our team will be happy to take a look.